
When you're trying to improve your website's performance, it's easy to get lost in the weeds of optimizing images, cleaning up code, and messing with browser caching. All of that is important, but the real goal is simple: get your content in front of the user as fast as humanly possible.
Why? Because even a one-second delay isn't just a minor annoyance—it's enough to torpedo your engagement and kill conversions.
Why Website Performance Is Your Most Important Metric
Before we start tweaking settings and running tests, let's get one thing straight. Website performance isn't just some item on an IT checklist. It's a core driver of your business. The speed and responsiveness of your site have a direct, measurable impact on everything from user happiness and search engine rankings right down to your bottom line.
Here’s a good way to think about it: a slow website is the digital version of a brick-and-mortar store with ridiculously long checkout lines. People get frustrated. They leave. This exact scenario plays out millions of times a day online, where patience is practically non-existent.
The Financial Cost of a Slow Website
The link between your site's speed and your revenue is crystal clear. If you run an e-commerce store, a one-second delay could literally mean thousands of dollars in lost sales over a year. For a B2B company, it's the difference between snagging a high-value lead or watching them click away to a competitor who didn't keep them waiting.
Website speed isn't just a technical metric—it directly impacts user behavior, search rankings, and business revenue on a global scale. Studies consistently show that even tiny delays in page load times can have a dramatic effect.
A single second of added load time can cause a 7% drop in conversions. That might not sound like much, but let's do the math. For a business pulling in $100,000 a day, that's a staggering $365,000 lost every year. The small delays really do add up.
To put this in perspective, here's a quick look at how those fractions of a second hurt your key metrics.
The Impact of Load Time on Key Business Metrics
| Load Time Increase | Impact on Bounce Rate | Impact on Conversions |
|---|---|---|
| 1s to 3s | Bounce rate increases 32% | Drops significantly |
| 1s to 5s | Bounce rate increases 90% | Often drops by half |
| 1s to 6s | Bounce rate increases 106% | Plummets to near zero |
As you can see, the relationship is brutal. The longer you make people wait, the more certain it is they'll leave without buying a thing.
This infographic paints a pretty clear picture of that chain reaction.
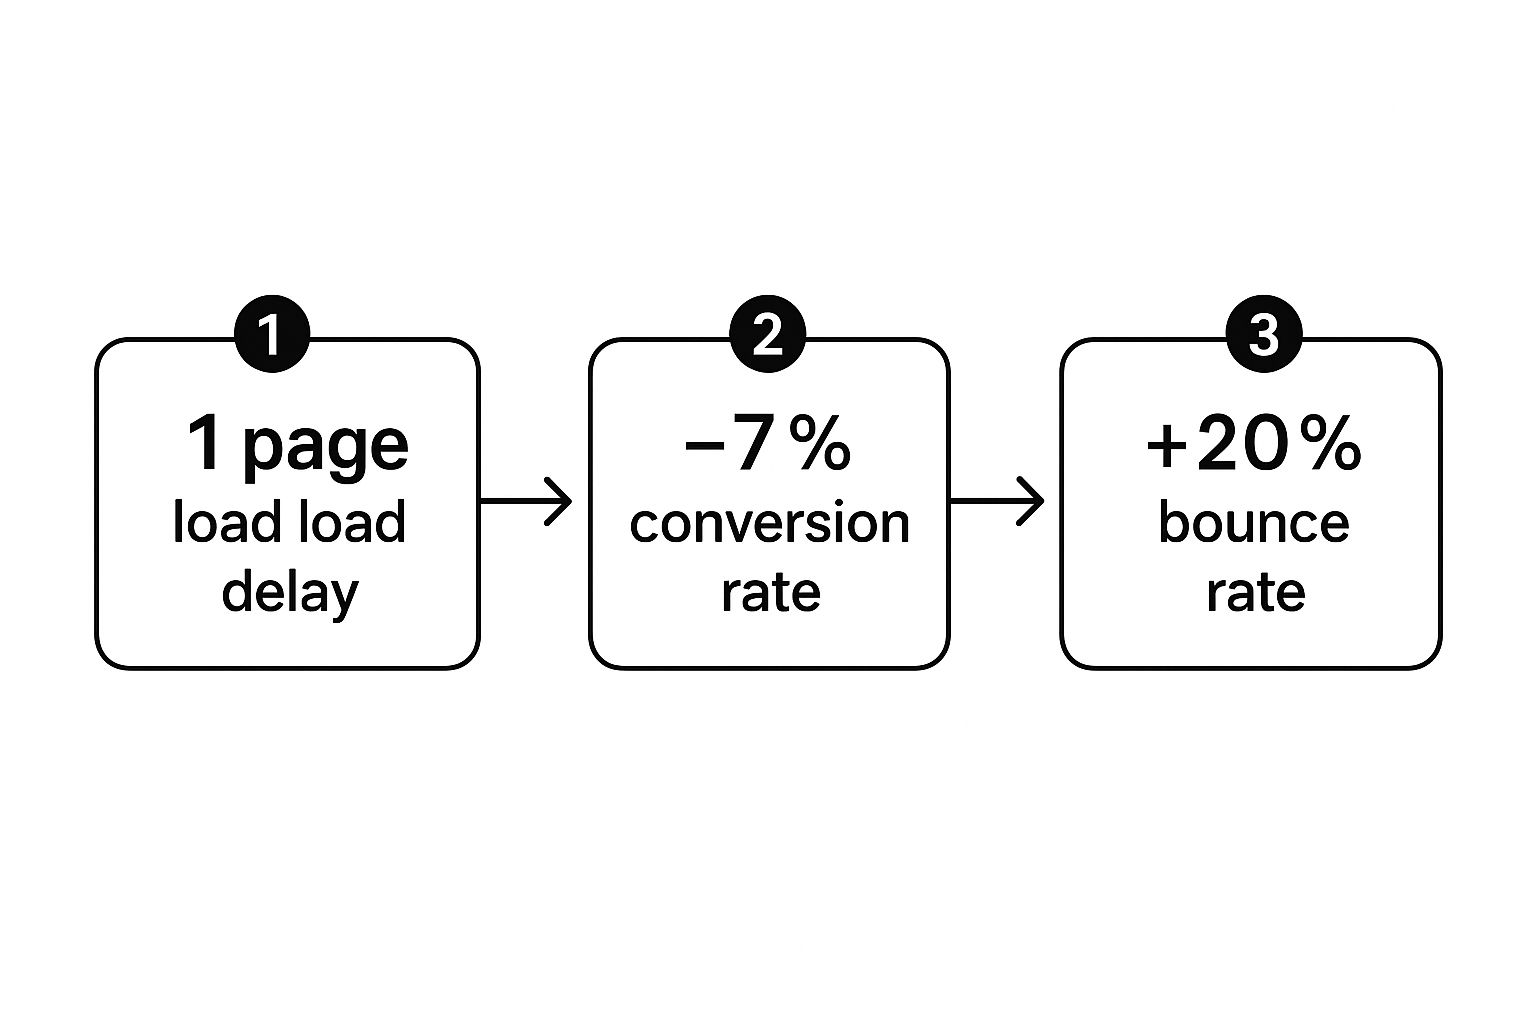
It’s a direct line from poor performance to poor business outcomes. There’s really no ambiguity there.
Performance Beyond the Desktop
These days, optimizing for performance really means optimizing for mobile first. More people are browsing on their phones than on desktops, and they're often doing it over spotty network connections. A site that feels snappy on a high-end desktop hooked up to fiber internet can be painfully, unusably slow on a smartphone.
This is why adopting a mobile-first mindset isn't just a nice-to-have anymore; it's absolutely essential if you want to reach your whole audience. We actually have a great guide that dives deeper into what is mobile-first design.
It also helps to understand what's happening on the user's end of the connection. Learning a bit about how to optimize internet speed and boost Wi-Fi gives you perspective on the challenges your visitors might be facing.
Once you start framing performance as a cornerstone of your digital strategy, you’re in the right headspace to make improvements that truly matter.
Diagnosing Speed Issues with the Right Tools
You can't fix what you can't measure. That nagging feeling that your site is "slow" isn't enough—you need data. The first real step is moving from a vague hunch to a concrete, data-backed action plan. This means getting comfortable with the tools that pinpoint exactly where the bottlenecks are.
A fantastic place to start is Google's PageSpeed Insights. It's free, intuitive, and gives you a clear performance score along with a punch list of actionable recommendations.
Here's what a typical report looks like. It immediately flags key metrics like LCP, INP, and CLS, giving you a health check at a glance.
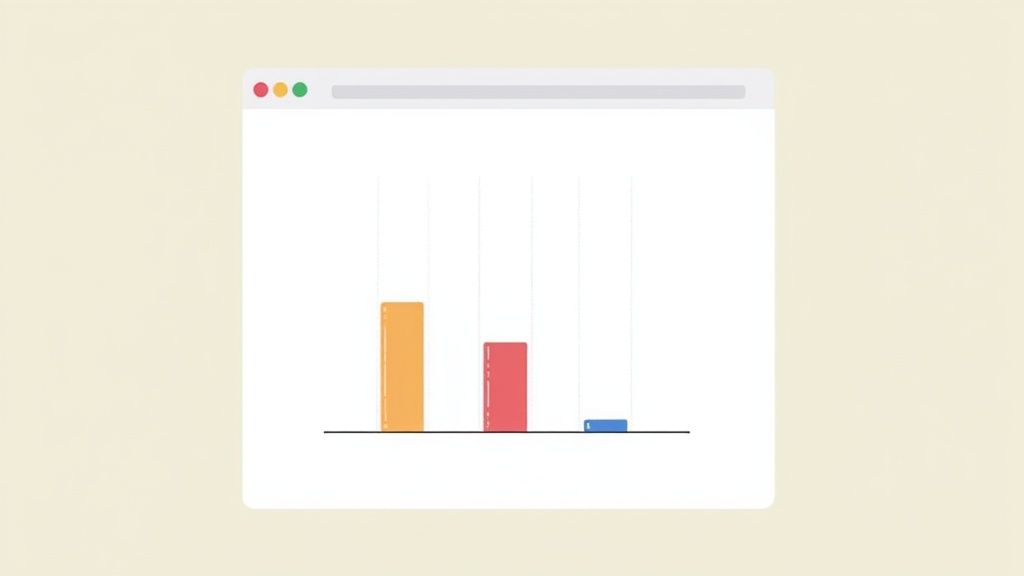
The best part? It turns abstract problems into a tangible checklist. Instead of just knowing your site is slow, you see why—maybe you need to optimize images or slash some unused JavaScript.
Understanding Lab Data vs. Field Data
When you run a test, you'll notice two kinds of data: lab data and field data. Knowing the difference is a game-changer.
- Lab Data: This is a performance checkup in a perfect, controlled environment. Think of it as a simulation on a consistent device with a stable network speed. It's brilliant for debugging and testing changes before you push them live.
- Field Data: This is the real deal—data collected from actual users visiting your site. It captures the true experience of your audience across all their different devices, spotty Wi-Fi connections, and locations. This is what Google uses for its Core Web Vitals assessment.
A site might ace a lab test but still feel sluggish for a user on a shaky 4G connection. Always treat field data as your ultimate source of truth for user experience.
Decoding Key Performance Metrics
To make any sense of these reports, you have to speak the language of performance metrics. The most important ones today are Google's Core Web Vitals.
These three benchmarks have become central to technical SEO, completely reshaping how we optimize sites. Google's intense focus on them means you need to be watching them like a hawk. It’s no coincidence that websites on the first page of Google's search results typically load in just 1.65 seconds—speed is a massive competitive edge.
Let's break them down quickly:
- Largest Contentful Paint (LCP): This is all about loading performance. It measures the time it takes for the largest image or text block to become visible. Your target here is 2.5 seconds or less.
- Interaction to Next Paint (INP): This one measures responsiveness. It tracks the lag between a user's action (like a click or tap) and the moment the page visually responds. A good INP is under 200 milliseconds.
- Cumulative Layout Shift (CLS): This metric is for visual stability. It quantifies how much the page layout unexpectedly jumps around while loading. Annoying, right? A good CLS score is 0.1 or less.
As you start digging into these numbers, remember that your site's foundation plays a huge role. Sometimes, the problem isn't your code or images—it's the server itself. Before you spend hours tweaking code, it might be worth choosing a high-performance website hosting service, as that can be a fundamental step toward better performance.
By arming yourself with the right tools and a solid grasp of these metrics, you can build a clear, data-driven roadmap to a faster site.
Optimizing Images and Media Without Sacrificing Quality
If there's one thing that consistently drags a website's performance down, it's large, unoptimized media files. Images and videos are non-negotiable for creating an engaging user experience, but they're almost always the heaviest assets a browser has to download.
Getting this part right can deliver some of the most dramatic speed improvements you'll see. The goal isn't to ditch rich media entirely—it's to serve it intelligently. It's all about finding that perfect balance between visual quality and file size so your site stays both beautiful and fast.
The stakes are higher than you might think. Even a tiny 0.1-second improvement in page speed can boost conversions by 8.4%. Every single kilobyte you save really does matter.

Choose Next-Gen Image Formats
Still relying on old-school JPEGs and PNGs? You're leaving a ton of performance on the table. Modern browsers are built to handle next-generation formats that offer far superior compression without sacrificing quality.
- WebP: This format, developed by Google, is a game-changer. It creates files that are typically 25-34% smaller than an equivalent JPEG, with no noticeable drop in quality. It supports both lossy and lossless compression, making it incredibly versatile.
- AVIF: If you need the absolute best compression, especially for high-detail hero images or product photos, AVIF is your answer. It's newer than WebP and often produces even smaller files.
Switching your main images over to these formats will make a serious dent in your page weight. The good news is that most modern CMS platforms and image optimization plugins can handle the conversion for you automatically.
Implement Smart Compression and Resizing
Just picking the right format isn't quite enough. You also need to apply smart compression, a process that strips out data the human eye is unlikely to notice.
Here’s a pro tip: never upload a massive 4000-pixel image just to have it displayed in a 500-pixel container. Always resize your images to the maximum dimensions they'll be shown at before you upload them. This one simple habit prevents your users from downloading huge, unnecessary files.
Tools like Squoosh or ImageOptim are fantastic for dialing in that perfect balance between file size and visual fidelity. If you want to go deeper on this, we've got a whole guide on how to optimize images for web performance.
Serve Responsive Images for Every Device
Serving the same huge desktop banner image to a tiny mobile screen is a massive waste of bandwidth. This is where responsive images come into play, and they're a must-have for modern web performance.
By using the srcset attribute in your HTML, you can give the browser a menu of different-sized versions of an image. The browser then gets to be the smart one, picking and downloading only the most appropriate size based on the user's device and screen resolution.
It looks something like this in your code:

This simple snippet ensures mobile users get a small, fast-loading image, while desktop users see the high-resolution version they expect.
Defer Offscreen Media with Lazy Loading
Finally, remember that not every single image needs to load the second someone lands on your page. That's where lazy loading comes in.
This technique tells the browser to hold off on loading any media assets until they're just about to scroll into the user's view. By implementing lazy loading for all images and videos "below the fold," you drastically cut down the initial load time. The browser focuses only on what's immediately visible, making your site feel lightning-fast and giving your Largest Contentful Paint (LCP) score a healthy boost.
Streamlining Your Code and Putting the Browser to Work
Moving beyond images and videos, the very code that builds your pages—HTML, CSS, and JavaScript—is a goldmine for performance gains. I've seen firsthand how clean, efficient code isn't just a "nice-to-have" for developers; it directly impacts how fast a browser can download, understand, and actually render your website for a visitor.
Every extra comment, space, or unnecessary line of code adds a tiny bit of weight. It might seem insignificant, but when you multiply that by thousands or even millions of visitors, those little bytes snowball into a real drag on your load times. This is exactly where minification comes into play.
Shrinking Your Code with Minification
Minification is a simple, automated process that intelligently strips out all the fluff from your code files without breaking anything. Think of it as vacuum-sealing your code—it removes all the air (unneeded characters) to make the package much smaller.
This process tidies up three main file types:
- HTML: It gets rid of code comments and extra white space.
- CSS: It removes comments, spaces, and even combines duplicate style rules.
- JavaScript: It cuts out comments and white space, and often shortens variable names to save a few more bytes.
The end result is a dramatically smaller file that the browser can grab and process in a fraction of the time. Thankfully, you don't have to do this by hand. Most modern development tools and platforms like WordPress have plugins or built-in features that handle minification automatically. It's a quick win.
Prioritizing What Loads First
Let's be honest: not all code is equally important. The CSS that styles your header and hero section is critical. The JavaScript for that chat widget in the footer? Not so much. Loading every single script and stylesheet at once creates a digital traffic jam, leaving your visitors staring at a blank white page.
This is why deferring non-critical resources is such a game-changer. By instructing the browser to load less important JavaScript and CSS after the main content has appeared, you free it up to render the visible part of the page first. This massively improves the perceived load time, which is what really matters for keeping people from bouncing.
Your number one job is to get meaningful content in front of the user as fast as humanly possible. Deferring secondary scripts means your core message isn't held up by a non-essential analytics tracker.
Tapping into Browser Caching
For anyone who visits your site more than once, browser caching is probably the single most powerful performance trick you have. It’s a simple concept: you tell the visitor’s browser to save a copy of your site’s static files—like your logo, CSS, and JavaScript—on their own computer.
When they come back for a second visit, their browser doesn't have to re-download all those files from your server. It just pulls them from its local storage. The difference is staggering, often resulting in near-instant page loads. This creates an amazing experience for your returning audience and lightens the load on your server.
Here's a quick breakdown of how different caching types fit together.
Caching Strategy Comparison
Each caching method plays a different role in speeding up your site. Browser caching is fantastic for repeat visitors, while server-side caching helps everyone by reducing the work your server has to do. A CDN, on the other hand, focuses on closing the physical distance between your content and your users.
| Caching Method | Best For | Typical Performance Gain |
|---|---|---|
| Browser Cache | Static assets (images, CSS, JS) for repeat visitors. | Drastic reduction in load times for returning users. |
| Server Cache | Dynamic content and database queries. | Reduces server processing time for all users. |
| CDN Cache | Serving assets from geographically close locations. | Improves speed for a global audience. |
Getting this right comes down to properly configuring the cache-control headers on your server. When you see a high "cache hit ratio" in your analytics, you know your caching strategy is working effectively, with most requests being served instantly from a cache instead of your server.
Speed Up Your Site Worldwide with a CDN

If you have users visiting your site from all over the world, you're eventually going to hit a wall that no amount of code optimization can break through: physics. The physical distance between your server and your visitor creates a delay called latency. Data simply takes time to travel across oceans and continents.
This is where a Content Delivery Network (CDN) becomes a game-changer. Think of a CDN as a network of proxy servers scattered across the globe, each holding a cached copy of your site's static files—things like images, CSS, and JavaScript.
When someone visits your site, the CDN jumps in and serves those files from the server physically closest to them. This simple shift dramatically shortens the data's travel time.
How a CDN Really Moves the Needle on Performance
So, instead of a user in London having to wait for files to travel all the way from a server in Los Angeles, they get them from a local server, maybe just down the road. It’s a huge difference.
But the benefits don't stop with international visitors. By handling all the requests for static files, a CDN takes a massive load off your main server. This frees up your server's resources to do the heavy lifting, like handling dynamic content and database queries, making the site faster for everyone.
The numbers back this up. Websites using a CDN can slash their latency by up to 27% and see load times improve by an average of 50%. These aren't just vanity metrics; they directly impact user experience. In fact, sites with a CDN often report a 15% lower bounce rate.
Getting Started with a CDN
Jumping into the world of CDNs is much easier than it sounds. You don't need to be a network engineer to get one up and running.
When you're picking a provider, here’s what to look for:
- Global Reach: Does their network have Points of Presence (PoPs) in the regions where your audience is?
- Easy Setup: Look for services with straightforward integration, especially plugins for platforms like WordPress if that's what you use.
- Performance and Security: Check reviews, uptime stats, and what kind of security features (like DDoS protection) are included.
- Price: Many great CDNs, like Cloudflare, have generous free plans that are perfect for getting started and scale with you as you grow.
A CDN isn't just for massive enterprise companies anymore. It's a fundamental, accessible tool for delivering a consistently fast experience to every single user, no matter where they are.
For many sites, implementing a CDN is one of the single most impactful performance optimizations you can make. And if you're deep in the weeds with modern frameworks, you can take this concept even further. For instance, we have a guide on using a Tailwind CDN in your HTML to serve your styles just as efficiently as your other assets.
Common Website Performance Questions
As you start digging into site optimization, questions are bound to bubble up. It's totally normal to wonder where you should focus your energy first or how to make sense of the endless list of potential fixes.
Let's walk through some of the most common questions we get about improving website performance.
How Often Should I Check My Website’s Speed?
Think of website performance less like a one-time project and more like a regular health check-up. As a good rule of thumb, you should run a full performance audit at least once every quarter. This gives you a steady baseline, letting you track improvements over time and spot new issues before they snowball into bigger problems.
That said, you should absolutely run a quick check after any significant change to your site. This could be anything from:
- Installing a new plugin or theme
- Rolling out a major new feature or script
- Redesigning a key page, like your homepage
These kinds of updates can have unexpected side effects on performance, so a quick pass with a tool like PageSpeed Insights is always a smart move.
What Is a Good Page Load Time to Aim For?
While "as fast as possible" sounds about right, having a concrete target is much more helpful. The goal you should be shooting for is getting your key pages to load in under two seconds. Study after study has shown that user patience falls off a cliff right around the three-second mark.
Aiming for a load time under two seconds puts you in a great competitive position. Many sites on the first page of Google load in just 1.65 seconds, proving that speed is a critical factor for top rankings and happy users.
It's also worth remembering that perceived performance matters just as much. If your Largest Contentful Paint (LCP) is lightning-fast and the page feels interactive almost immediately, users will see the site as fast, even if a few minor scripts are still loading in the background.
What’s More Important: Lab Data or Field Data?
This is a classic one, and the answer is: you need both. They just serve different purposes.
Field data, often called Real User Monitoring (RUM), is your ultimate source of truth. It’s raw data from your actual visitors using their own devices, browsers, and network connections. This is what Google uses for its Core Web Vitals assessment, so it has a direct impact on your SEO.
Lab data, on the other hand, is your go-to for debugging. It gives you a controlled, repeatable environment where you can test changes and pinpoint specific bottlenecks without all the noise of real-world variables.
So, use lab data to diagnose and fix problems, but always use field data to confirm that your fixes actually worked for real users.
My Site Is Really Slow. Where Should I Even Start?
Feeling overwhelmed when you see a low performance score is completely normal. The key is to ignore the noise and start with the low-hanging fruit—the things that will give you the biggest bang for your buck.
- Optimize Your Images: This is almost always the number one offender. Properly compressing images, resizing them for the web, and using next-gen formats like WebP can slash your page weight like nothing else.
- Get Caching in Place: Set up browser caching and look into a page caching solution. This can give repeat visitors a practically instant loading experience.
- Use a CDN: A Content Delivery Network (CDN) is one of the single most effective upgrades you can make for global load times. Many, like Cloudflare, have free plans that are incredibly easy to get running.
If you tackle just these three areas first, you'll likely solve a huge chunk of common performance issues and have a much better foundation to work from.
Ready to build stunning, high-performance websites without the headache? Magic UI gives you a library of over 50 customizable components built with modern, speed-focused technologies. Create beautiful landing pages in minutes at https://magicui.design.